Natural Hazards
Hurricanes and Storm Surges
Prepared by ICoD – Euro-Mediterranean Centre on Insular Coastal Dynamics (Valletta, Malta) & the Editorial Board
A hurricane is a system of violent thunderstorms with high winds circulating about a central low-pressure area, called the eye. Air pressure flows from higher pressure towards lower pressure, although not in a straight line because the Earth’s surface spins at different speeds (faster at the equator, slower near the poles); in fact, it spirals inwards, generating the typical cyclonic storm shape associated with a hurricane.
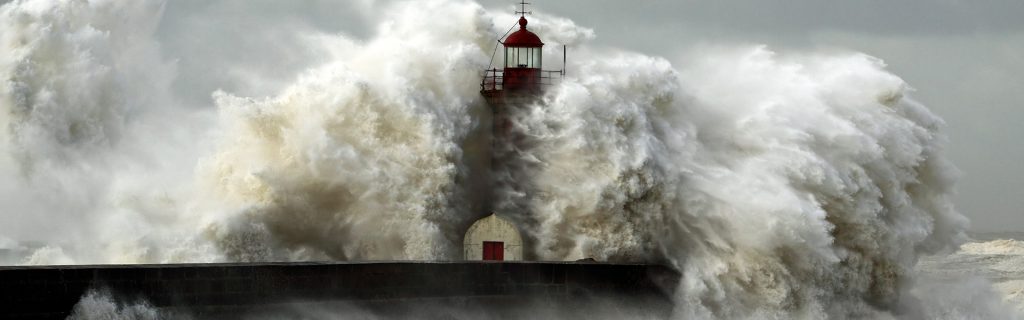
A storm surge is ocean water levels that have been elevated above that expected from astronomical tides and which are caused by a passing storm.
A reduction of atmospheric pressure causes sea water to rise by circa 1cm for each 1 mb. pressure drop (the inverse barometer effect) together with wind stress which pushes water towards the coast and the drag/stress on the sea surface by wind being measured as horizontal force per unit area. This is a function of wind speed and air density. Strength and direction play a large part in elevating the sea surface, as winds blowing towards a coast produce a much greater sea level rise than off shore winds. Additionally, wind effects increase inversely with water depth, so shallow sea areas such as Bangladesh have amplified surges. Surges are major causes of coastal erosion and death by drowning via flooding. Storm surges are affected by a number of variables that include winds, coastline shape, water depth near the coastline, and storm size and structure.
There is a dire need for countries to assess these parameters, particularly for storm surge vulnerable coasts.
A storm surge is ocean water levels that have been elevated above that expected from astronomical tides and which are caused by a passing storm. A reduction of atmospheric pressure causes sea water to rise by circa 1cm for each 1 mb. pressure drop (the inverse barometer effect) together with wind stress which pushes water towards the coast and the drag/stress on the sea surface by wind being measured as horizontal force per unit area. This is a function of wind speed and air density.
Strength and direction play a large part in elevating the sea surface, as winds blowing towards a coast produce a much greater sea level rise than off shore winds. Additionally, wind effects increase inversely with water depth, so shallow sea areas such as Bangladesh have amplified surges. Surges are major causes of coastal erosion and death by drowning via flooding.
Storm surges, are affected by a number of variables that include winds, coastline shape, water depth near the coastline, and storm size and structure. There is a dire need for countries to assess these parameters, particularly for storm surge vulnerable coasts.
Storm size and structure
Tropical storms with winds revolving around an ‘eye’ of low pressure at speeds of 120 kilometres per hour and over, will when hitting the coast, often generate storm surge flooding. Such storms are called by different names depending on where they occur. Thus a strong Tropical cyclone (the generic term for a non-frontal synoptic scale low-pressure system over tropical or sub-tropical waters with thunderstorm activity and definite cyclonic surface wind circulation (**) can also be called a Hurricane or a Typhoon. (** Holland, G.J. (1993): “Ready Reckoner” – Chapter 9, Global Guide to Tropical Cyclone Forecasting, WMO/TC-No. 560, Report No. TCP-31, World Meteorological Organization; Geneva, Switzerland)
- “Tropical cyclone” (the Southwest Indian Ocean).
- “Severe tropical cyclone” (the Southwest Pacific Ocean west of 160°E or Southeast Indian Ocean east of 90°E).
- “Hurricane” (the North Atlantic Ocean, the Northeast Pacific Ocean east of the dateline, or the South Pacific Ocean east of 160°E).
- “Typhoon” (the Northwest Pacific Ocean west of the dateline).
- “Severe cyclonic storm” (the North Indian Ocean).
(source: Atlantic Oceanographic and Meteorological Laboratory (AOML) / National Oceanic and Atmospheric Administration (NOAA) – http://www.aoml.noaa.gov/hrd/tcfaq/A1.html)
The very large difference in pressure between the outer edges and the ‘eye’ of the storm of such low-pressure systems, produces strong winds circulating around and moving in towards the centre of the storm. In the northern hemisphere the winds circulating around such a hurricane turn in a counterclockwise direction; inversely, they spin in a clockwise direction in the southern hemisphere. This is the result of the Coriolis effect (a consequence of the earth’s rotation).
At the centre of the hurricane one can find an area of calm clear sky (ranging from 5 – 50km in diameter, depending on the size of the hurricane). The eye of the storm is surrounded by an eye-wall which hosts the strongest winds and this in turn is surrounded by spiralling high winds and torrential rain. On the edges of the hurricane, wind speeds become more moderate.
When the atmospheric pressure in an offshore area is lower than its surroundings it produces an area under the influence of a low pressure weather system.
The low pressure cells + strong winds + atmospheric lift result in cyclonic storms.
Tropical or ‘equatorial cyclones’ are so named due to their origin being largely in the Tropics.
Formation is characteristically in moist (maritime) and warm (tropical) air masses. The process of rising moist (maritime) air produces heat that gives rise to condensation of the water vapour in the moist air. This in turn generates tropical cyclones. Such storms are characterized by thunderstorms that produce strong winds and flooding.
(source: http://www.weatherquesting.com/hurricane-spin.htm)
A hurricane is a system of violent thunderstorms with high winds circulating about a central low-pressure area, called the eye. Air pressure flows from higher pressure towards lower pressure, although not in a straight line because the Earth’s surface spins at different speeds (faster at the equator, slower near the poles); instead, it spirals inwards (see Figure 1).
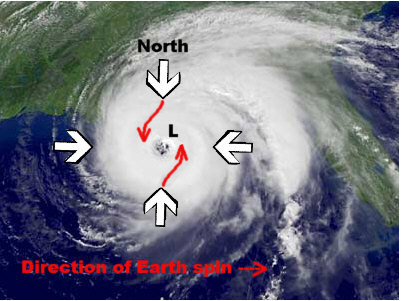
In the Northern Hemisphere for example, higher-pressure areas from the north, west, east and south will move towards a low pressure centre (L in the above diagram).
The air to the north moves eastward slower than the low-pressure area while the air to the south moves faster than L. The different speeds cause the air to circulate counter-clockwise about the low.
Tropical cyclones are also associated with the generation of Tornadoes which are powerful, rotating funnels of air.
Tornadoes are linked:
- at their top, to clouds involved in thunderstorms and other intense weather (typically tall, dense clouds that are the result of atmospheric instability).
- at their base with the earth’s surface where they are often encircled by debris.
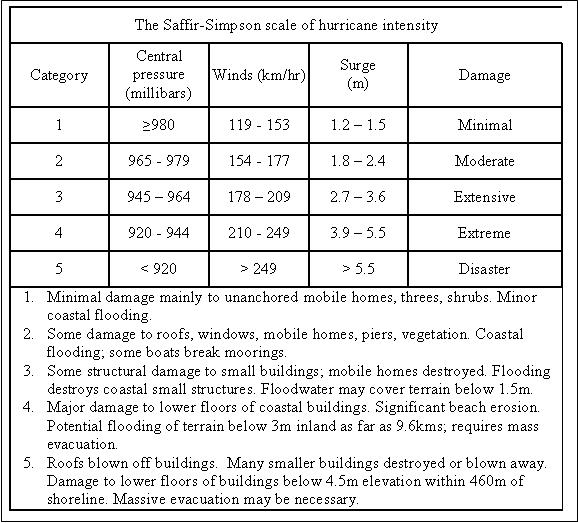
There are no specific storm surge types but they could be classed according to their scale of flooding which is directly related to the Hurricane intensity that generates the storm surge.
Hurricane intensity is classified on the Saffir-Simpson scale (1 lowest to 5 highest), renamed now as the Saffir-Simpson Hurricane Wind Scale.
The Saffir-Simpson scale of hurricane intensity
Two distinct types of meteorological disturbances contribute to major storm surges that cause erosion, flooding and associated drownings. These are tropical and extra tropical cyclones. Both are rapid onset natural hazards that can last for days.
a) Tropical cyclones are large low pressure systems (<100 to several hundred km across) that intensify between latitudes circa 5º and 25º. Sea surface temperatures must be high (>26 ºC) with high relative humidity and evaporation, weak vertical wind shear and atmospheric instability (Henderson-Sellers and Lewis, 1998; Landsea et al, 1999). At its centre is an ‘eye’ an area of calm clear sky, surrounded by an eyewall which hosts the strongest winds around which spiral rain bands of high winds and rain, all rotating in a counter clockwise movement in the northern hemispheres, vice versa in the southern hemisphere. Tropical cyclones are small but powerful.
b) Extra-tropical cyclones cause the bulk of flooding and beach erosion in temperate latitudes. The wind speeds and surge heights are much lower than in tropical cyclones but they have a much larger extent, i.e. >1000 km) and invariably extend over several tidal cycles. The USA storms (nor’easters) have been classed again into 5 categories based on the significant wave height (H1/3 = average of 1/3 highest waves), duration (D) and Power (P) where P = H21/3.
Once a tropical cyclone hits the coast, the severity of storm surge impact is influenced by a number of aspects:
- offshore sea depth.
- coastline configuration.
- cyclone orientation as it lands.
- wind characteristics (speed, intensity).
- cyclone radius.
Storm surges are pronounced:
- over shallow water bodies
- persistent strong winds
- persistent low atmospheric pressure.
Resulting in coastal flooding that may impact many kilometers inland.
Storm surges are particularly pronounced:
- in areas having a large tidal range
- when occurring at high tide
Under such circumstances, the resulting surge is called a storm tide that includes the accumulative sea level elevation arising from the:
- storm
- tide
- wave run-up
- freshwater flooding.
Wherever low pressure systems (<100 to >1000 km) occur and these intensify over warm waters of the ocean between latitudes circa 5º and 25º. The winds blow onshore and in coastal areas, especially those with broad, shallow shelves which funnel (e.g. Bohai Bay, China, Gulf of Bangladesh, the German Fresian bight), strong surges can occur. They are amplified when they coincide with above average astronomical tides – new or full moon (spring tides) and at the solstices and equinoxes. (Wood, 1986). These are reinforced when they coincide with perigee (moon-earth at its closest) or perihrlion (earth –sun closest) tides. High latitude tides are further reinforced during the 18.6 year lunar nodal cycle when the angle between the moon’s orbit plane and eliptic is at a minimum.
Outside of the Tropics, mid-latitude storms and their associated cold fronts are the main cause of storm surges.
Coastal regions are particularly sensitive to tropical cyclones since the latter are generated over warm ocean bodies. Much of a cyclone’s energy will be dissipated at the coast resulting in weaker wind storms over inland areas. However, the potential threat of heavy rainstorms remains, posing serious flooding hazards for the hinterland.
Some 19.5% (391,812 km2) of the combined coastal territory of 84 countries is vulnerable to inundation from a one-in-100-year storm surge by current reference standards. A 10% future intensification as a consequence of predicted sea level rise, increases the potential inundation zone to 25.7% (517,255 km2), taking into account sea level rise. This translates to an inundation threat for an additional 52 million people; 29,164 km2 of agricultural area; 14,991 km2 of urban area; 9% of coastal GDP and 29.9% of wetlands, with Latin America/Caribbean having the biggest surge impact, whilst the coastal GDP losses could be very severe in East Asia and Latin America.
On Feb 1, 1953.a storm originating in the North Sea hit the Netherlands inundating 150,000 ha and killing >1800 people. Prior to this in 1281, > 80,000 died and in 1421 > 100,000.
The surge of 2.7m at Southend also caused much damage in eastern UK (Alexander, 1993).
Alexander, D. 1993 Natural disasters, Chapman and Hall, New York.
Bangladesh is particularly vulnerable, having a low topography so that the coast is virtually at sea level, shallow continental shelf, high tidal range and a high population density. In 1970 >220,000 people died with a recorded surge of >9m (Pugh, 1987; Murty and Flather, 1994); 11,000 died in May, 1985 and circa 200,000 died in 1991 (Alexander, 1993). The Saxby gale of 1869 caused huge damage along the Bay of Fundy, Canada with a surge >2m The Galveston, USA, hurricane in 1900, raised water levels by >5m killing around 6,000 people; in 1938 a hurricane with a 2m surge swept across Long Island and southern New England killing >700 people (Ludlam, 1988); the Ash Wednesday storm of 1962 affected the entire eastern seaboard of the USA and lasted over five tidal cycles. In 1992, the New York metro was flooded by a >2m surge, resulting in human loss of life; and property damage; the Halloween storm’ of 1991, basis of the film, ‘The Perfect Storm’, Hugo in 1989 in South Carolina, Andrew in 1992 in the Florida Keys and Katrina for New Orleans all give evidence of surges that cost lives and property.
Ludlam, D.M. 1988. The great hurricane of 1938, Weatherwise, 41, 214-216.
Murty, T.S., and Flather, R.A., 1994.Impact of storm surges in the Bay of Bengal, In Finkl, C.W. Jr. (ed.) Coastal hazards: Perception, susceptibility and Mitigation. J Coastal Research, SI 12, 149-161.
Pugh, D.T. 1987. Tides, surges and mean sea level. J Wiley and Sons, Chichester.
Nichols et al (2008) investigated 136 port cities around the world having >one million inhabitants in 2005, to exposure of coastal flooding due to storm surge and damage due to high winds in the 2070’s. Across all cities, about 40 million people (0.6% of the global population or roughly 1 in 10 of the total port city population in the considered cities) are exposed to a 1 in 100 year coastal flood event. By the 2070s, total population exposed could grow to circa 150 million due to the combined effects of climate change (sea-level rise surges and increased storminess), subsidence, population growth and urbanisation. Asset exposure could reach US $35,000 billion by the 2070s; more than ten times current levels rising to some 9% of projected global GDP in this period. On a global-scale, population growth, socio-economic growth and urbanization are the most important drivers of the overall increase in exposure.
Nicholls, R.J., Hanson, S .,. Herweijer, N., Patmore,, S. Hallegatte, J., Corfee-Morlot, J., Château and R. Muir-Wood (2), 2008. Ranking port cities with high exposure and vulnerabilitiy to climate extremes exposure estimates, Environment Working Papers No.1, OECD, 68pp.
Mediterranean cyclones are infrequent to rare with debate concerning their typology (tropical cyclones, subtropical cyclones or polar lows). They develop over open waters under strong, initially cold-core cyclones, similar to subtropical cyclones in the Atlantic Basin with typically non-tropical origins (source: http://en.wikipedia.org/wiki/Mediterranean_tropical_cyclone).
While Mediterranean sea surface temperatures in late-August and early-September range between +24 to +28°C, research indicates water temperatures of 20 °C are normally required for cyclone development and it appears that elevated cold air may bebe the main trigger for instability in the development of these systems.
It has been suggsted that a “hurricane season in the Mediterranean would be June – November ( similar to the North Atlantic hurricane season).
Recent US National Academy of Sciences study has shown powerful links between rising ocean temperatures in the key hurricane breeding grounds of the Atlantic and Pacific and an increase in the intensity of such storms.(source: http://www.theaustralian.news.com.au/story/0,25197,22080458-30417,00.html). For example:
- 2004, Cyclone Catarina, South Atlantic
- 2005 Hurricane Vince, Madeira in Portugal, an area that had never before produced such storms. It even struck Spain – another first.
- 2005, New Orleans overwhelmed by Hurricane Katrina.
- 2005: US Gulf coast, Hurricane Rita, the 4th most intense Atlantic hurricane ever recorded.
It has been further suggested that climate change induced warming in the Mediterranean may be enabling it to store enough heat to trigger the formation of its own hurricanes.
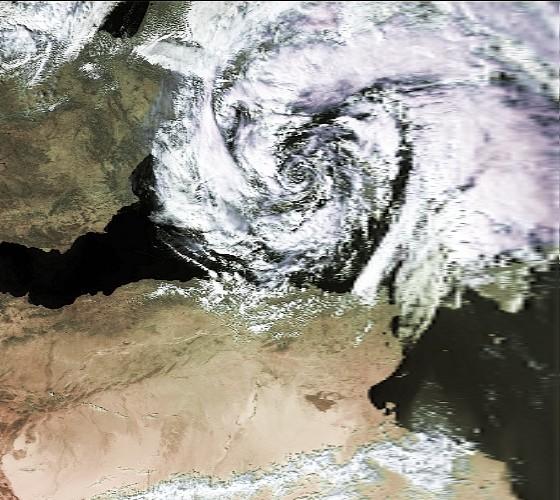
Mediterranean tropical cyclone – October 6-10, 1996 which resulted in serious flooding in the Balearic Islands, Sardinia, and south Italy. Winds of up to 145 km/h were reported over the Eolian Islands, causing infrastructural damage and four deaths. (source: http://en.wikipedia.org/wiki/Mediterranean_tropical_cyclone)
- Human loss
- Flooding = environmental loss & & economic cost
Hurricanes account for more hurricane deaths than any by winds. Low-income countries, in particular are susceptible to very significant damage, e.g. El Salvador, Yemen, Mozambique. Urban areas in these countries lack an infrastructure that can cope with storm drainage and what exists is often old and neglected.
Hallegatte et al (2008) using Copenhagen as a case study, showed that was not highly vulnerable to storm surges and coastal floods. Man-made defences, are necessary, as without them, economic losses caused by a current 10 yr storm surge event, would reach Euros 2.5 billion Without man-made defences, sea level rise would increase coastal flood risks in a significant manner, i.e. 50 cm of sea level rise would increase by 55% the losses caused by the 120-yr event, from Euros 3 to 5 billion.
Stéphane Hallegatte ,Nicola Patmore , Olivier Mestre, Patrice Dumas, Jan Corfee Morlot, Celine Herweijer and Robert Muir, 2008. Assessing Climate Change Impacts, Sea Level Rise and Storm Surge Risk in Port Cities: A Case Study on Copenhagen, OECD Environment Working Paper, No. 3.
- Consequences may be lessened through raising public awareness.
- Improving meteorological forecasting can give due warning of such events, so that time is given for evacuation. However, this is more suitable for developed countries and less so for countries with emerging economies where large populations live in low lying & mainly agricultural regions which are very susceptible to the impact of surge floods and where information is often not available and/or adequately disseminated to the population early enough.
- Man-made defences, are necessary, as without them, economic losses caused by a current 10 yr storm surge event, would reach Euros 2.5 billion.
- Without man-made defences, sea level rise would increase coastal flood risks in a significant manner, i.e. 50 cm of sea level rise would increase by 55% the losses caused by the 120-yr event, from Euros 3billion to 5 billion.
Hurricanes and storms that generate storm surges are natural phenomena and we cannot control these. Nonetheless, it has been suggested that global warming (the climate change aspect heavily influenced by human-made green house gases emissions) can trigger off meteorological instability resulting in more frequent and intense hurricanes / surges. In this context, curbing global warming will contribute to lessening potential trends of increasing hurricane / storm surge activity.
Yes. Weather forecasts particularly through mathematical modelling are now sufficiently good to predict surges and they are constantly being improved. The main problem with forecasts of such hazards is the system’s ability to adequately disseminate this information. A number of models are used e.g. the WES Implicit Flooding Model and the SLOSH model used by the US National Weather Service for real time forecasting. The main data inputs require minimum central pressure, radius, storm track and speed. Other models also exist, e.g. Hubbart and McInnes, (1997) which treats the land-water boundary as a moving interface, inland grid cells flooding as the water level rises.
Emmanuel et al, (2008) via model estimates achieved from simulations of 2000 storm tracks indicate that storm/surge frequency will decrease in the Southern Hemisphere and north Indian Ocean, whilst increasing in the western North Pacific. Simulations show that changes in tropical cyclone activity is highly influenced by an increasing difference as climate warms between the moist entropy of the boundary layer and that of the middle troposphere. The model uses ‘a specialized, coupled ocean–atmosphere hurricane model phrased in angular momentum coordinates, which provide a high resolution of the core at low cost’.
Kerry Emanuel, Ragoth Sundararajan, and John Williams, 2008. Hurricanes, and Global Warming: Results from Downscaling IPCC AR4 Simulations, Bulletin of the American Meteorological Society, 89(3) 47–367
The Sea, Lake, and Overland Surge from Hurricanes (SLOSH) model
- Provides real time forecasting and hurricane storm surge inundation maps for the U.S. Atlantic coast, Oahu, the Bahama Islands, Puerto Rico, and the Virgin Islands. (source: http://www.wunderground.com/hurricane/surge_images.asp).
- Accuracy of the SLOSH model is advertised as +/- 20%. It provides 2 sets of images:
- “Maximum Water Depth“ – water depth at each grid cell of the SLOSH domain. Thus if inland at elevation of 10ft > MSL, and combined storm surge and tide ( “storm tide”) is 15ft at your location, then the water depth image will show 5ft of inundation.
- “Maximum Storm Tide“ – how high above mean sea level the sum of the storm surge plus the tide reaches.
- Over the ocean, the storm tide and water depth images will show the same values.
- Images are generated for high tide, thus showing worst-case inundation scenarios for mid-strength hurricanes of each Saffir-Simpson Category (1- 5).
However, the US National Hurricane Center no longer includes storm surges and flooding for hurricane categories stating that people are not acting upon warnings. In part, this may be a result of past discrepancies that have occured between forecasted and actual. For example, Hurricane Ike, a Category 2 on the Saffir-Simpson scale, had winds of 96-110 mph, and a storm surge of 3.5 – 6.8m. The forecasted storm surge was of a Category 5 storm i.e. winds greater than 155 mph. A Category 2 hurricane, on the Saffir-Simpson scale, has a storm surge of 6 to 8 feet. (1.8 to 2.8m)
No, not unless we unless we can control the weather. What is needed is more disaster preparation.
- Identify high risk areas prone to storm surges (storm surge maps).
- Collect empirical data needed to obtain return period curves for flooding and storms (particularly for countries with emerging economies).
- Operate a storm surge forecasting system.
- Develope / improve an information and warning dissemination system.
- Evacuate high risk areas (e.g. low lying coastal areas) when a storm surge / hurricane is forecasted.
Damage reduction is the core of hazard mitigation, defined as the cost-effective measures taken to reduce the potential for damage on a community from the hazard impact. Hazard mitigation is sustained action to reduce or eliminate the long-term risk to people and property from hazards and their effects. A hazard mitigation programme should have 5 main objectives:
- Maintain and if possible enhance environmental quality;
- Maintain and if possible enhance life quality;
- Identify intergovernmental equity;
- Identify community concerns and issues;
- Foster local resilience to disasters.
Basically coastal risk mitigation can be grouped into four main areas:
- Planning: relates to beach and coastal management plans. Coastal hazards should be identified and addressed at the planning stage in coastal development, so that high risk are identified and where possible, the public directed away from the high risk area, or warned.
- Education: refers to coastal safety education starting from primary school; it also includes all beach users including national and international tourists
- Safety resources: refer to the personnel and resources.
- Medical support: the back up if someone is rescued or resuscitated and in need of urgent medical attention. This includes access for ambulance and helicopters, nearby medical support and well-trained and equipped lifeguards.
People should be moved out of low-lying areas when a storm surge / hurricane is forecasted. Therefore warnings similar to that espoused for tsunamis, are needed in all areas at risk. Empirical data needed to obtain return period curves for flooding and storms are not available for the bulk of Third World countries, so a storm induced surge is estimated by mathematical models e.g. the WES Implicit Flooding Model (Butler and Sheng, 1982). The US National Weather Service has the SLOSH model (Jelesnianski et al, 1992) for real time forecasting. Inputs need minimum central air pressure, storm radius, storm track and speed. Short period ‘wave run up’ is omitted and the model is regularly used in the US. Other models also exist, e.g. Hubbart and McInnes, (1997) which treats the land-water boundary as a moving interface, with inland grid cells flooding as the water level rises.
References
Butler, H.L and Sheng, Y.P. 1982. ADI procedures for solving the shallow water equations in transformed co-ordinates. Proc 1982 Army Numerical Analysis and Computers, ARO report, 82-3. 365-380.
Hubbart, G..S and K.L McInnes, 1997. A storm surge inundation model for coastal planning and impact studies, J. Coastal Research, 15, 168-185.
Jelesnianski, C.P., Chen., P., and W.A Shaffer, 1992. SLOSH: Sea, lake and overland surges from hurricanes. NOAA, National Weather Service, Silver Spring, NOAA Technical report, NMW 48.
History teaches us that a lack of hurricane awareness and preparation are common threads among all major hurricane disasters. By knowing your vulnerability and what actions you should take, you can reduce the effects of a hurricane disaster.
Storm surge safety actions include:
- Listen and heed the weather forecasts and if possible gather your family together;
- Try to get to high ground or on top of a sturdy structure so that the water passes below/through the structure;
- Stay calm and try to have clean water with you;
- If possible, use a mobile phone to contact the Emergency authorities.
The National Hurricane Centre of the US National Weather Service (http://www.nhc.noaa.gov/) provides the following evacuation information.
- Minimize the distance you must travel to reach a safe location; the further you drive the higher the likelihood of encountering traffic congestion and other problems on the roadways.
- Select the nearest possible evacuation destination, preferably within your local area, and map out your route. Do not get on the road without a planned route, or a place to go.
- Choose the home of the closest friend or relative outside a designated evacuation zone and discuss your plan with them before hurricane season.
- You may also choose a hotel/motel outside of the vulnerable area.
- If neither of these options is available, consider the closest possible public shelter, preferably within your local area.
- Use the evacuation routes designated by authorities and, if possible, become familiar with your route by driving it before an evacuation order is issued.
- Contact your local emergency management office to register or get information regarding anyone in your household whom may require special assistance in order to evacuate.
- Prepare a separate pet plan, most public shelters do not accept pets.
- Prepare your home prior to leaving by boarding up doors and windows, securing or moving indoors all yard objects, and turning off all utilities.
- Before leaving, fill your car with gas and withdraw extra money from the ATM.
- Take all prescription medicines and special medical items, such as glasses and diapers.
- If your family evacuation plan includes an RV, boat or trailer, leave early. Do not wait until the evacuation order or exodus is well underway to start your trip.
- If you live in an evacuation zone and are ordered to evacuate by state or local officials, do so as quickly as possible. Do not wait or delay your departure as it will only increase your chances of being stuck in traffic or not being able to get out at all.
- Expect traffic congestion and delays during evacuations. Expect and plan for significantly longer travel times than normal to reach your family’s intended destination.
- Stay tuned to a local radio or television station and listen carefully for any advisories or specific instructions from local officials. Monitor your Weather Radio.
The Virginia (US) Department of Emergency Management suggest the following steps in the preparation of a home evacuation plan:
- Coastal residents should become familiar with their designated evacuation routes and know where they will go if ordered to evacuate. Emergency officials have designated hurricane evacuation routes for Hampton, the Eastern Shore, Norfolk, Poquoson, the Middle Peninsula, the Northern Neck, Virginia Beach and York County. City or county officials will issue a evacuation order if conditions warrant it. If you have questions about your area’s evacuation routes, you can contact your local emergency manager.
- Residents living inland should know where to go if ordered to evacuate their area. Flash floods can develop in a matter of minutes, with little or no warning. Know ahead of time where your family should go to find higher ground.
- Identify ahead of time where you could go if you have to leave your home. Choose several places, such as a friend’s home in another town, a motel and a shelter.
- Remember that evacuation shelters often do not supply pillows, blankets or sheets. Bring these items with you.
- Animals other than service animals are usually not permitted into evacuation shelters. Make a plan ahead of time with a friend or relative, a veterinarian or a kennel that offers pet sheltering. Visit the Virginia Department of Agriculture and Consumer Services Office of Communications (VDACS) pet emergency planning http://www.vdacs.virginia.gov/animals/petshelter.shtml for more information.
- When severe weather is approaching, make sure you emergency supplies kit is nearby and listen to local radio or TV stations for evacuation instructions — you might have only minutes to act.
- Keep the telephone numbers of evacuation shelters with a road map. You may need to take alternate or unfamiliar routes if major roads are closed or clogged.
- Be sure to review your evacuation plan regularly to ensure that all of the information contained in it is still up to date. Make sure that all family members are familiar with the plan.
Tidal storm surge maps (http://www.hremc.org/surge.htm)
The vulnerability of a coastal community to flooding as a consequence of hurricane activity can be evaluated by assessing storm surge maps specifically created for a region:
- Surge maps give a general indication of the extent of flooding that might be experienced from various categories of hurricanes.
- It is important to understand the given information: the flooding assessment can be considered as the worst case considering all direction storm scenarios.
- Surge maps do not indicate depth of flooding and they don’t take into account flooding related to heavy rainfall accompanying a hurricane.
- The extent of flooding also depends on the variations in low or high tide conditions.
What are they used for?
Maps showing possible flooding areas due to storm surges are prepared by authorities to reduce the risk of possible losses within a coastal area. One such example is prepared by European Spatial Planning Observation Network (ESPON) as given below.
For maps and further information see:
www.metoffice.gov.uk/corporate/pressoffice/anniversary/floods1953.html – 27k –
www.nhc.noaa.gov/HAW2/english/storm_surge.shtml – 45k –
www.nhc.noaa.gov/HAW2/english/storm_surge.shtml – 45k –
Storm surge – Wikipedia, the free encyclopedia
en.wikipedia.org/wiki/Storm_surge – 113k –
www.metoffice.gov.uk/corporate/pressoffice/anniversary/floods1953.html – 27k –
www.ohsep.louisiana.gov/factsheets/stormsurges.htm – 57k –
www.comet.ucar.edu/nsflab/web/hurricane/313.htm – 7k –
www.youtube.com/watch?v=-R78DHqFOyY – 135k –
USATODAY.com –
www.usatoday.com/graphics/weather/gra/gsurge/flash.htm – 2k –
blogs.worldbank.org/climatechange/risk-intensified-storm-surges-high-stakes-developing-countr… – 51k –
www.cnn.com/2009/US/weather/05/15/hurricane.scale/index.html – 71k –
www.newscientist.com/article/mg20227025.100-hurricane-speed-reveals-where-storm-surges-will-s… – 53k